How to Read the Detected Contaminants Table in an Ohio CCR
A detected-contaminants table can look like a wall of abbreviations, limits and lab results. The key is to read across each row, not focus on a detection in isolation. This walkthrough explains what the columns mean, how to compare results with limits, and what the table can—and cannot—tell you about the water at your own faucet.
What the detected-contaminants table is for
A Consumer Confidence Report, or CCR, summarizes information about a public water system’s drinking water. Its detected-contaminants table is a structured way to show contaminants, results and related information. It is useful, but it is not a complete picture of every water quality question a household might have.
Ohio EPA says the table must include data for regulated contaminants; contaminants subject to an MCL, as well as unregulated contaminants for which Ohio EPA requires monitoring. It is not meant to list every operational test result. For example, Ohio EPA says operational test results such as hardness do not belong in this table. Hardness may still matter for household concerns like scale or soap performance, but it is a different kind of result from the regulated-contaminant data summarized here.
A CCR table helps you answer several practical questions:
- Which contaminants were included in the report?
- What units were used to report each result?
- What level was found, and what range of results is shown?
- Is there a listed MCL or MCLG?
- Does the row say there was a violation?
- What sample year and typical source are reported?
Read these details together. A detected result is not, by itself, a verdict about whether the water is safe or unsafe. The units, the applicable limit, the range and any violation information all affect how to interpret the entry. For background on finding the report itself, see How to Find and Read Consumer Confidence Reports in Ohio. For context on report timing, see When Ohio Water Systems Must Deliver the Annual Water Quality Report.
It also helps to remember what a CCR describes. A system-wide report does not necessarily describe the water coming from one particular household tap. The report’s sampling and reporting information is important, and plumbing in an individual building can affect water at the faucet. See Does an Ohio CCR Describe the Water at Your Own Faucet? if you need to understand that distinction.
Read across the columns, one row at a time
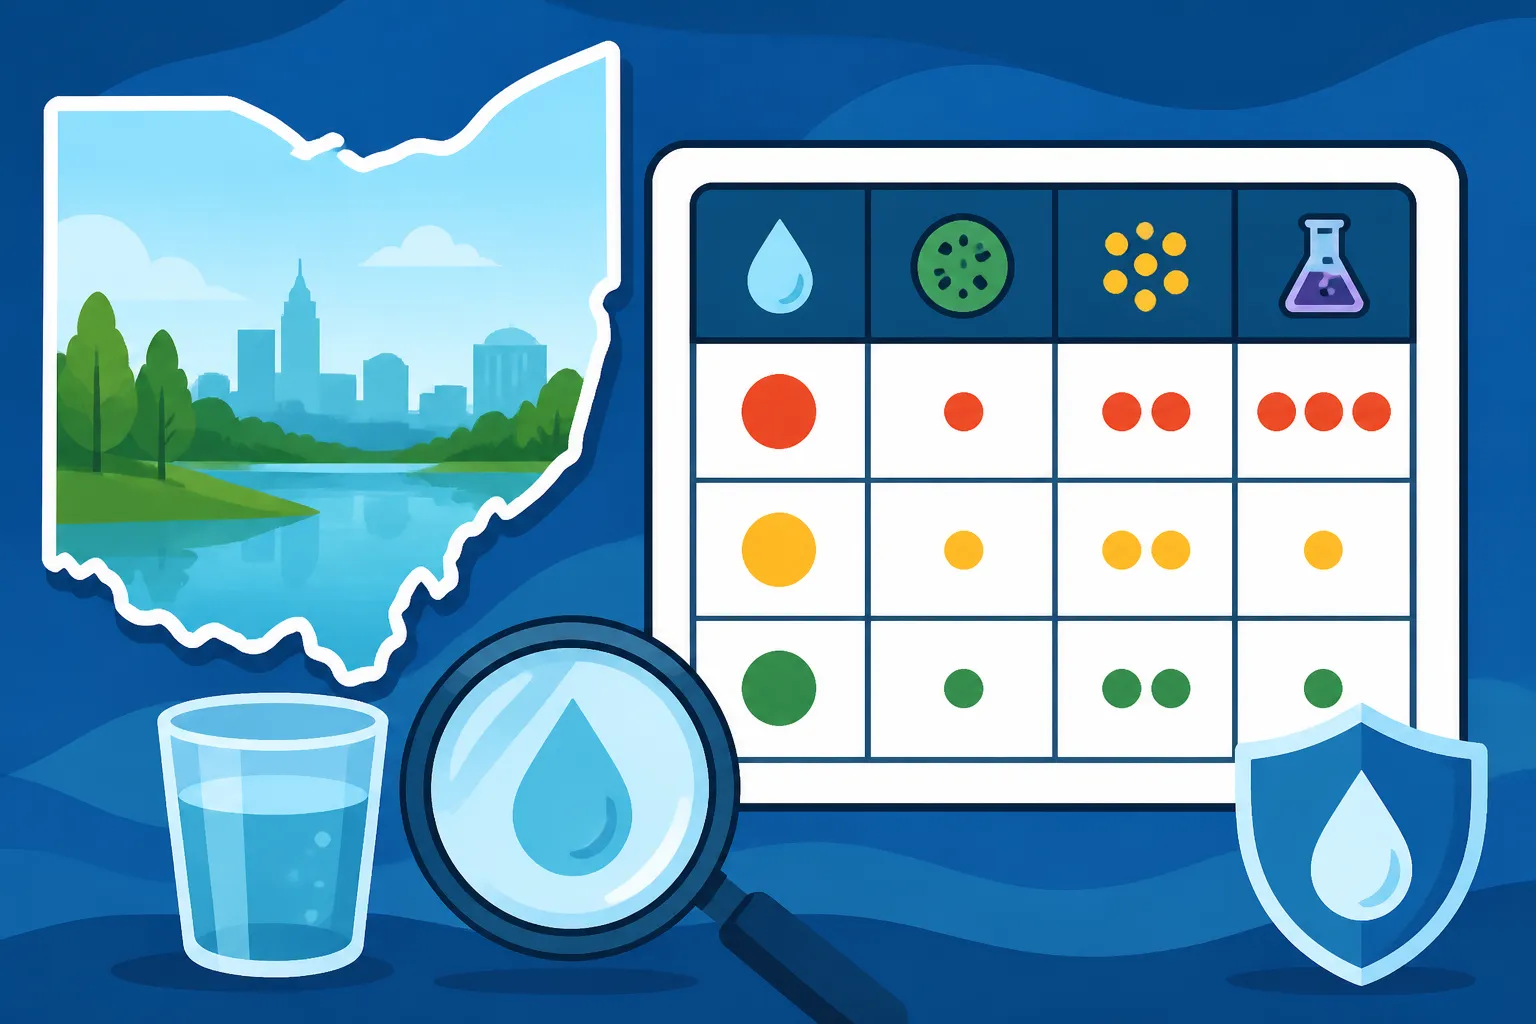
Ohio EPA identifies the expected table columns as: Name, Units, MCL, MCLG, Level Found and Range, Violation, Sample Year, Typical Source. A table may take some effort to scan, especially if it uses abbreviations or notes that refer to text elsewhere in the report. Begin with the contaminant name, then move across the row rather than jumping straight to the result.
| Column | What to look for | A useful reading habit |
|---|---|---|
| Name | The contaminant or contaminant group listed | Check whether the report gives an abbreviation or a fuller name elsewhere |
| Units | The measurement unit used for the result | Compare values only when they use compatible units |
| MCL | The listed maximum contaminant level, when applicable | Read the report’s definition and compare it with the result using the same units |
| MCLG | The listed maximum contaminant level goal, when applicable | Keep it distinct from the MCL; the report must define both |
| Level Found and Range | The reported level and any range of detections | Check whether the entry is an average, a range, or both, as described in the report |
| Violation | Whether the table identifies a violation | Read any accompanying explanation rather than inferring the reason from the result alone |
| Sample Year | The year associated with the reported sample information | Check how recent the data are relative to the report year |
| Typical Source | A general source associated with the contaminant | Treat this as context, not proof of the source at your particular home |
The “Name” column is the starting point, but it may not be enough to identify what the entry represents. A contaminant may appear under an abbreviation, a chemical name or a grouped category. If the meaning is unclear, check the report’s glossary, footnotes or explanatory text before drawing a conclusion.
“Units” tells you how to read the value. A number without its unit can be misleading, and values reported in different units should not be compared as if they were directly equivalent. If you are unsure what an abbreviation means, look for a definition in the report or ask the water supplier to explain its use.
The MCL and MCLG columns are related, but they are not interchangeable. Ohio EPA says MCL and MCLG definitions are mandatory in all CCRs. Find those definitions in the report and use them to understand the terms as the system presents them. For a closer look at how the two figures differ, see MCL vs. MCLG on an Ohio Water Report: Which Number Matters?
“Level Found and Range” is often the column readers go to first. Pause there long enough to understand what the entry represents. A reported level and a range provide different kinds of information: one describes a reported result, while a range shows the spread of detections reported for the entry. The report’s notes should clarify how its figures are presented. Do not assume that the highest number in a range is the same thing as the value used for every regulatory comparison.
The “Violation” column is also easy to misread. If it says there was a violation, look for the report’s explanation of what happened and what it means. If it does not identify a violation, that is information about the status shown in the table, but it does not answer every question about a specific faucet, building or plumbing fixture. For help reading the report’s explanation, see Making Sense of the Violations Section in an Ohio Water Report.
Finally, “Sample Year” and “Typical Source” provide context. The sample year helps you understand when the result was collected or reported. The typical source gives a general description associated with the contaminant; it does not establish where the contaminant came from in a particular home or prove that a nearby activity caused it.
Compare the result with the right limit
A common reading mistake is to see a detected result and stop there. Instead, check whether the row has an MCL, what units apply, what the report says about the level and range, and whether the violation column indicates a violation. These details work together.
When comparing a result with an MCL, first confirm that both figures use compatible units. Then check how the report describes the result. If the row includes a range, do not substitute one end of that range for the reported level without understanding what each value represents. If the report has a footnote or explanation, read it before deciding what the comparison means.
The MCLG column should be read separately from the MCL column. The report is required to include definitions for both terms, so use those definitions rather than treating the two columns as duplicate limits. A CCR can contain a result that is detectable while also showing no violation; that combination needs to be read in the context of the listed limits and the report’s explanation. A detection alone does not tell you whether the result exceeded an applicable MCL or whether the system reports a violation.
The reverse is also true: a table row marked as a violation deserves attention, but the row alone may not explain the circumstances. Check whether the report gives more detail in a violation section, notes or accompanying text. If the report does not make the meaning clear, ask the supplier to explain the entry and identify which monitoring result or requirement it concerns.
A practical way to read a row is to ask:
- What contaminant or category is named?
- What units does the report use?
- What does the report say the MCL and MCLG mean?
- Is the reported level a single value, a range or a combination?
- Does the violation column indicate a violation?
- Is the sample year clear, and are there notes that explain the result?
This process keeps a single striking number from becoming the whole story. It also helps you notice when the report is using an average or reporting a range, rather than presenting a result that can be compared without any extra context.
The table is not a personal diagnostic test for a home. If your concern is a particular contaminant or a result at your own faucet, the CCR may not provide the household-specific information you need. See Ohio Tap Water Guide: Sources, Safety Reports and Common Problems for a broader overview of what reports can tell you. For contaminant-specific interpretation, see Health Risk or Nuisance? Sorting the Detections in an Ohio CCR. If you have concerns about health effects, ask your local health department or a medical professional.
Check the sample year and monitoring details
The sample year is easy to overlook when a table has many rows. It matters because the result is tied to a particular period of sampling, not necessarily a measurement taken when you read the report. Ohio EPA says a CCR’s detected-contaminant table is not to include any data older than five years from the report year. That limit helps readers assess the age of information in the table, but it does not mean every row was sampled in the report year.
Check the sample year for the specific contaminant you care about. If the table includes a result from an earlier year, read any note that explains the monitoring schedule or why the result is presented. Do not assume that all contaminants in one table were sampled at the same time. If you want to understand where a particular system’s monitoring details are available, see Where to Look Up Monitoring Details for Ohio Public Water Systems. For more context on older results, see Some Results in an Ohio CCR Are Years Old. Is That Allowed?
Some entries may involve unregulated contaminants monitored through UCMR. If UCMR results are reported in the CCR, Ohio EPA says the table must include at least the average of any monitoring results from the year and the range of detections. In practice, that means you should look for both parts of the reported information, then check the table notes to understand how the average and range are presented.
Unregulated does not mean the substance was not measured. It means the row should be read in the context of the monitoring information and explanations provided, rather than assumed to follow the same presentation or regulatory comparison as every contaminant with an MCL. If you see a UCMR result and are unsure what it means for your supply, use the report’s explanatory material and ask the supplier which results were collected, what period they cover and how to interpret the figures.
A gap in the table is not automatically evidence that a contaminant was never present or that a system failed to test for it. The table’s contents depend on the required monitoring and reporting information for that entry. If a contaminant you expected to see is absent, look for the report’s monitoring notes or ask the supplier whether the substance was monitored and whether results are reported elsewhere. Avoid drawing conclusions from the absence of a row alone.
What to do when a row raises a question
If a table entry is confusing, start with the report, not a product recommendation or a guess based on the contaminant name. Look for definitions, footnotes, a violations explanation and any section describing sampling. Then ask the water supplier a focused question. For example, you can ask what the result represents, which sample year applies, how the range was calculated or where the report explains a listed violation.
If your concern is not about the system-wide report but the water at a specific tap, explain that distinction when asking for help. A CCR table and a test of water collected from an individual faucet answer different questions. Depending on the concern, the next useful step may be to ask the supplier about its sampling information or to discuss testing options with an appropriate professional. The right approach depends on the contaminant and the reason for concern.
A household may also be dealing with taste, odor, staining or another change that is not explained by the detected-contaminants table. Those observations do not identify a contaminant on their own. For a practical starting point, see Ohio Tap Water That Tastes, Smells or Looks Wrong: Where to Begin. Hardness, in particular, is an operational or aesthetic concern that Ohio EPA says does not belong in the detected-contaminants table; a result about hardness may need to be found elsewhere.
If you are considering treatment equipment, do not choose it based only on a contaminant name in a CCR. Match any product’s certification and reduction claim to the specific contaminant and your own test results. A system-wide report may not establish what is present at your tap, and treatment equipment is not a substitute for understanding the result. For help thinking through that decision, see Home Water Filters and Softeners in Ohio: Where to Start.
When a result raises a health question, contact your local health department or a medical professional. For questions about the report’s sample, units, violation status or monitoring information, contact the water supplier through its official website to find current contact details. Keep the question specific and refer to the contaminant name, sample year and table entry so the response addresses the row you are trying to understand.
Frequently Asked Questions
Does a detected contaminant mean there was a violation?
No. A detection and a violation are different pieces of information. Read the MCL, level and range, units, violation column and any related explanation together.
Why is hardness missing from the detected-contaminants table?
Ohio EPA says the table includes regulated contaminants and unregulated contaminants for which monitoring is required, not operational test results such as hardness. Hardness may be reported elsewhere or obtained through other information from the supplier.
Does every result in the table come from the report year?
Not necessarily. Check the sample year for each entry. Ohio EPA says the table is not to include any data older than five years from the report year, but a row may still reflect sampling from an earlier year.
What should I do if I do not understand a UCMR result?
Read the report’s notes about the average and range, then ask the water supplier what period the result covers and how it was calculated. If you are concerned about possible health effects, ask your local health department or a medical professional.
Sources
- Ohio Environmental Protection Agency — CCR Instructions Template (PDF) (checked November 13, 2026)
- Ohio Environmental Protection Agency — External CCR Checklist (PDF) (checked November 13, 2026)
Disclaimer
This article is for general informational purposes only and does not constitute professional advice. Laws, prices and regulations vary by location and change over time. Consult a qualified professional for guidance on your specific situation. Ohio Water Guide is not a government agency or water utility and is not affiliated with any public water system.